Speed of Sound
Lab 2: PHYS 471, Spring 2024
In this lab, we will measure the speed of sound in an Aluminum rod using an oscilloscope.
This lab consists of 2 Experiments
Experiment 1

Experimental Set Up
The experiment will be to find the $\Delta t$ between when the rod is struck by the mallet, and when the opposite end of the rod depresses the force sensor. The goal of this experiment is to resolve a small difference between two input signals and analyze that difference based on the expected physics. We will utilize the dual channels of the oscilloscope and measure both the DC voltage between the rod and the mallet and the AC signal from the Piezo sensor.
-
Connect the piezo element module to Ch. 1 of the oscilloscope. Set the input coupling to AC and choose a scale of a few Volts in the vertical direction and a slow horizontal scale. Experiment with applying a small pressure to the piezo element and noticing how the voltage generated by the crystal responds.
-
Connect the Ch. 2 input of the oscilloscope to the battery-mallet-rod module via the BNC connector. Connect the two blue wires to the banana plugs. Try tapping the end of the rod with the mallet and ensuring that you can detect the connection being made. You should see a very fast step function the measured voltage.
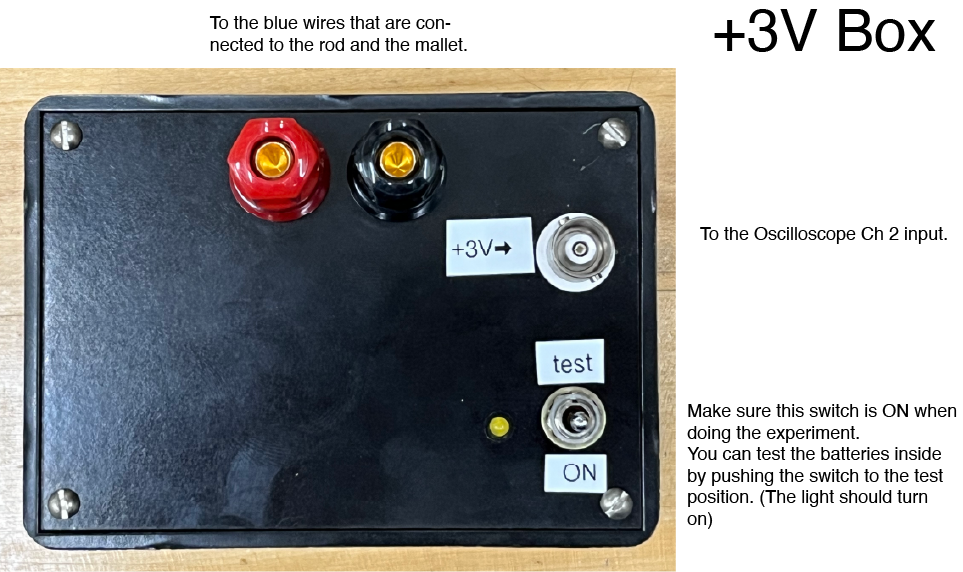
This box has batteries and a resistor inside to make a +3V power source.
-
After both inputs (the force sensor and the simple circuit through the rod and mallet) are working, you can do the experiment. Place the rod gentle right against the piezo element. Make sure the signals are all flat at not fluctuating. Use the trigger settings to set the oscilloscope to pause measurement after a suitable imput on Ch 2 (or Ch 1) is reached. This will take some trial and error to get right.
Example:
Tap the end of the rod with the mallet. (Gently, and make sure the other end is right up against the piezo element)
Record your Ch. 1 and 2 signals as functions of time.
You will expect to see something similar to this on your oscilloscope screen, if you have it all set up correctly. The red line shows the voltage on the Ch. 2 circuit, which will suddenly jump to a positive value when the mallet completes the electrical connection with the rod. The blue line shows the amount of force applied to the piezo element (in units of voltage since we have not calibrated our piezo with a Volts/Newtons conversion).
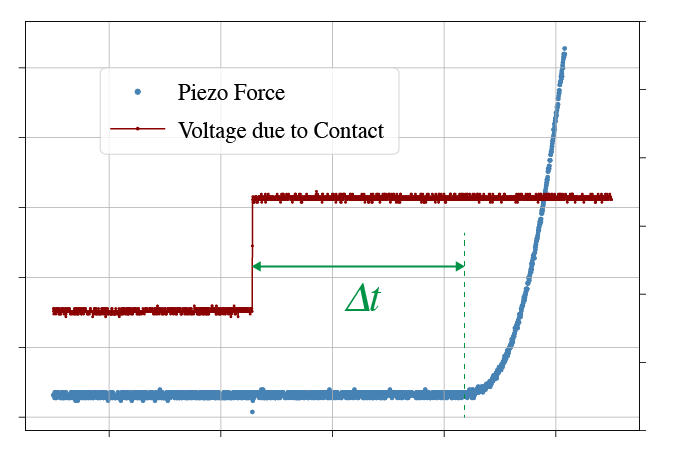
Example of the two channels during a successful experiment. The $\Delta t$ is shown in green.
To get our data in this lab, we will connect directly to the oscilloscope via USB cable to the desktop PC.
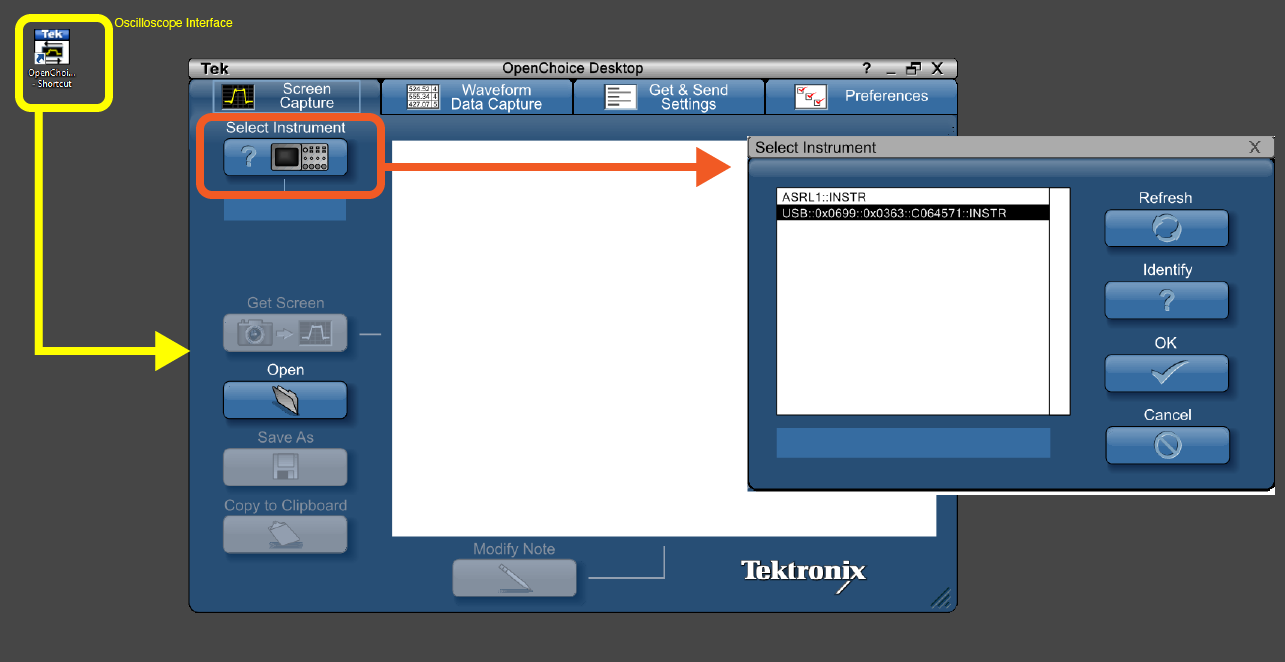
Oscilloscope Software. The software is called OpenChoice and a shortcut can be found on the desktop. You will want to verify that the USB instrument (i.e. the oscilloscope) is detected and selected.
You can easily record the screen image from the oscilloscope using the interfaced software. But, more useful is the ability to save the waveform data in a csv format.
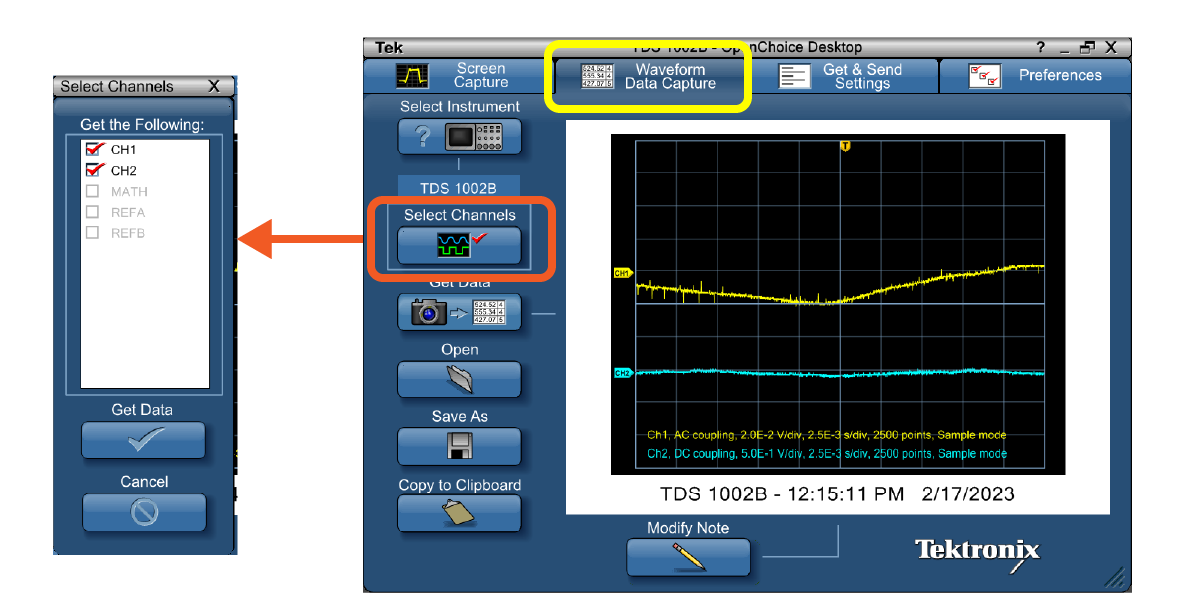
Select the channels to record for the data acquisition procedure.
Save your data for use later on in the analysis.
Experiment 2
Repeat the same process but this time use the copper rod. Careful! It's very heavy!
Report to submit:
Please type up a short report that shows your measurements and a calculation of the speed of the sound in the aluminum and copper rods. Since the actual experiment should only take about 10 minutes, spend some time thinking about how you could extract your $\Delta t$ from the data programmatically, instead of by hand. How would you tell the analysis code to find the step function in Ch 2? How can you identify the exact time when the piezo begins to compress? In a real lab, one would would want to be able to do this 50 times or so with different rods, and hopefully have some sort of automation routine. Include in your report some efforts towards this goal.
Compare your value to an accepted speed of sound (there are several depending on the type of wave - pick the one that makes the most sense).
Include:
- Brief Introduction
- Visual schematic of the experiment
- Plot of your data
- Comparison to theoretical prediction
- Links to your data online
- Links to your analysis code online
- References in proper format for any external sources you used.
- Scan of your handwritten lab notes.